Current methods of outbreak detection rely heavily on laboratory testing methods, syndromic surveillance from Emergency Room visits, and astute clinicians reporting observed anomalies to health departments. Due to the exponential growth rate of infectious disease transmission, the speed of an outbreak response, even at the order of magnitude of days, can enhance targeted mitigation efforts, save lives, prevent hospitals from reaching capacity, and avert associated healthcare costs.
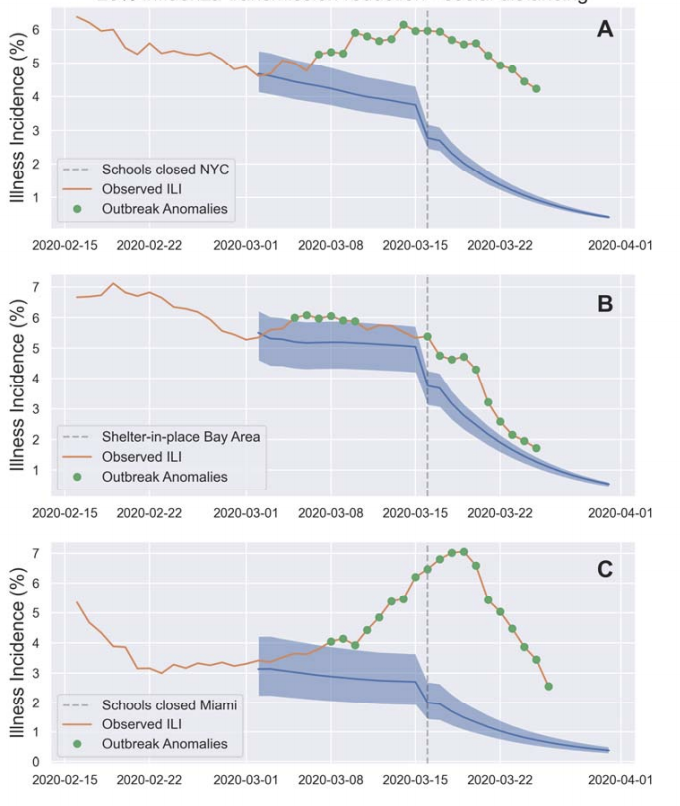
Detecting an anomaly in illness trends is one of the first steps in responding to an outbreak. An alternative system of anomaly detection is needed, particularly for novel pathogens that do not have laboratory testing infrastructure and that may cause illness symptomatically similar to others, an alternative system of anomaly detection is needed. To measure anomalous levels of febrile illness, we generate state and county-specific forecasts of seasonal influenza-like illness (ILI), and flagged observed values in Kinsa’s data that exceeded the 97.5% percentile of expected ILI trajectories as anomalies.
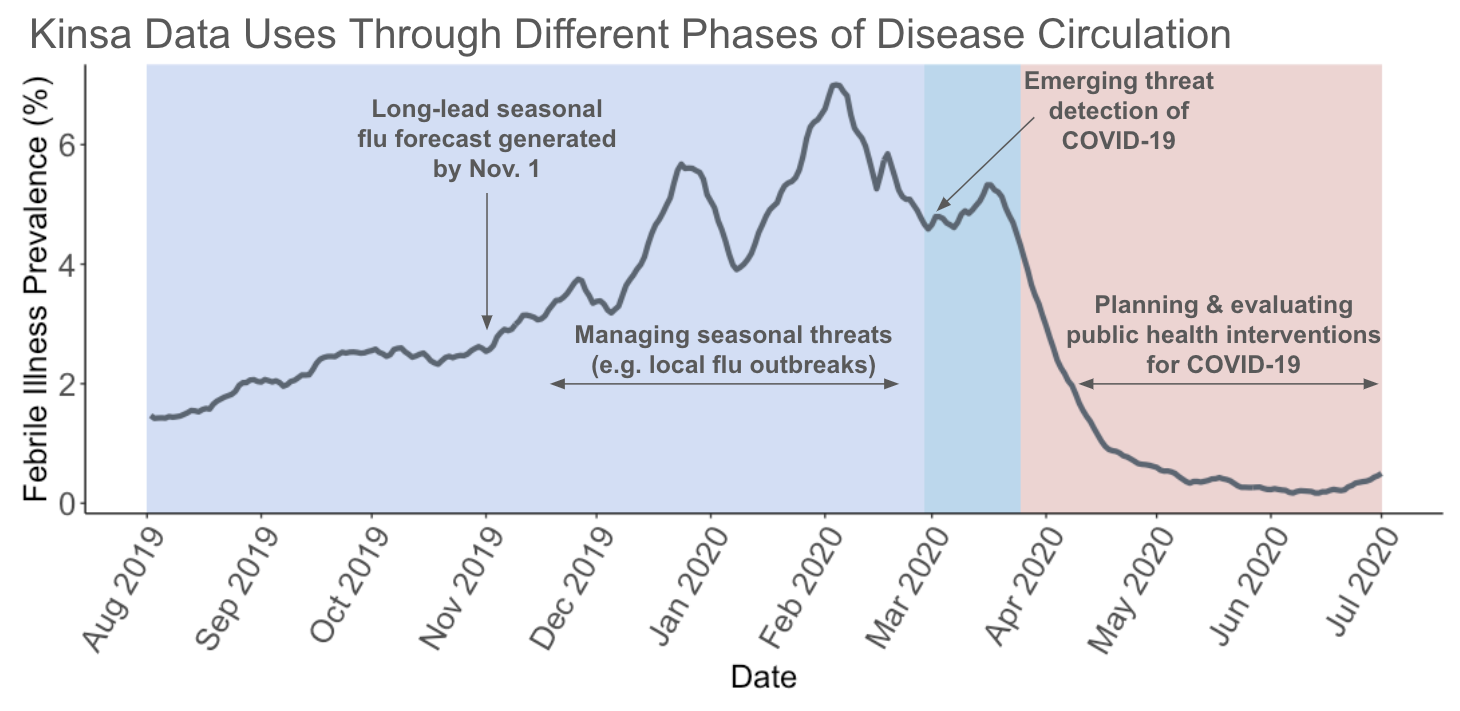
Early in the COVID-19 pandemic, Kinsa was able to detect anomalous levels of febrile illness that preceded COVID-19 case counts peaks by 18 days and that preceded the first COVID-19 death in a state by an average of 14 days. Kinsa’s anomalous febrile illness data was significantly correlated with COVID-19 cases that occurred up to three weeks following our observed signal, both at the state and county level.
1. Seasonal illness forecasting
Being able to predict the timing and magnitude of peak flu season allows for more targeted messaging about flu vaccinations, allocation of antiviral medications, placement of healthcare staff, and guidance for illness mitigation strategies, such as school closings. Most flu forecasting currently occurs with national, multi-state, or state granularity, and with one month of lead time.
In partnership with Oregon State University, Kinsa has developed city-specific flu forecasts with 30 weeks of lead time. Because the flu season varies geographically by factors such as climate and population density and size, we created city-specific “transmission templates,” using historical Kinsa fever data. For the 2018-19 flu season, we generated ensemble forecasts for the entire season parameterized with these historical templates using data up to November 1. The resulting forecasts strongly matched the observed data. Our unique capability to provide forecasts with long lead times with high geographic specificity provides jurisdictions with more actionable insights to plan ahead for flu season.
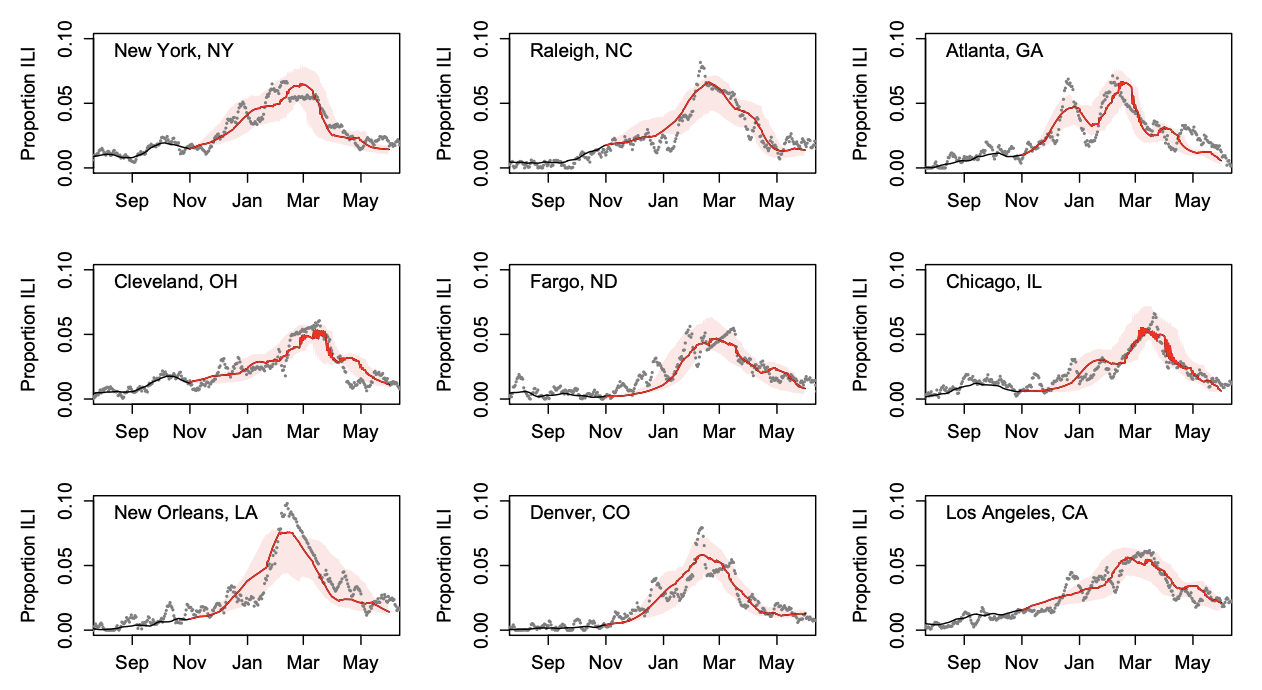
Additionally, Kinsa data has proven to be useful in “nowcasting,” or shorter term forecasting that helps account for reporting lags of more traditional surveillance data. Forecasts using both Kinsa fever data and CDC’s outpatient influenza-like illness surveillance system (ILINet) data at the state level performed better than those with CDC ILINet data alone, averaging a 43% reduction in error. Kinsa’s data is valuable in understanding flu-season in the near future, which can be important in shifting resource distribution as needs change.
2. Reducing school transmission
Several studies suggest that interactions at schools are a driver of seasonal ILI both among students and the community, as evidenced by the effect of closing school on circulating illness. One recent study suggests that COVID-19 transmission in the school setting is in part driven by adult educators transmitting to students.
Kinsa’s FLUency program provides thermometers for home use to families in elementaries schools, and provides school nurses with a portal to monitor illness within the school. The program is now in over 4000 schools (~5% of elementary schools). This provides the resources for boots-on-the-ground outbreak investigation and intervention by school nurses, who can track illness, provide appropriate care, and send ill children home from school if needed. This may be of particular use following the re-opening of schools as the COVID-19 pandemic decreases, as a recent study found elevated rates of other upper respiratory infections among students in recently reopened schools in Hong Kong.
Preventing transmission in the school provides the benefits of curbing transmission in the household as well: in a study in collaboration with the University of Iowa, we found that within households with a Kinsa thermometer, there were 4.4-5.1 times as many potential transmission events originating from a child than from an adult.
3. Monitor household transmission
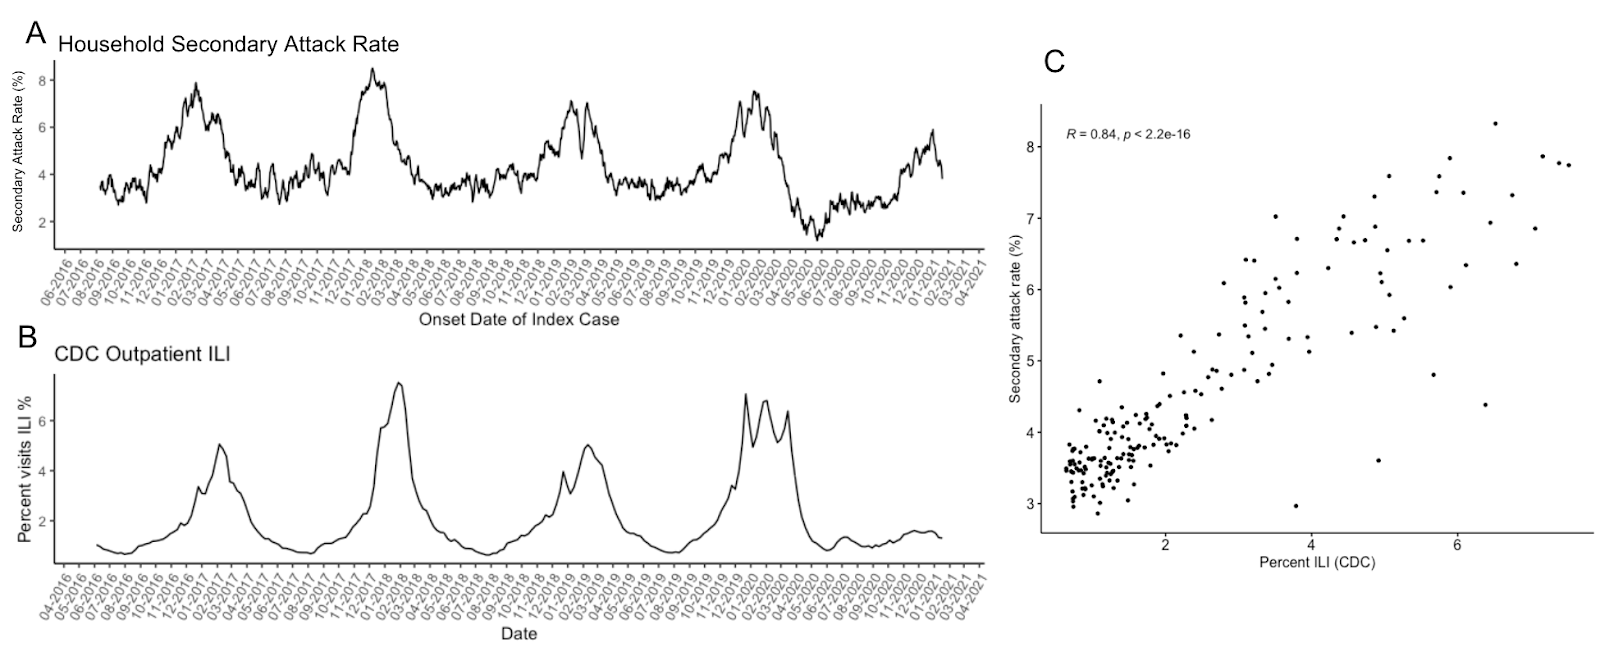
Understanding household transmission dynamics of communicable diseases can help develop containment strategies and identify risk factors for illness spread. Unlike traditional methods of population-level disease surveillance that do not capture household transmission, Kinsa users are able to assign symptoms and temperature readings to individuals within a household, allowing for the ability to evaluate illness spread within a household.
Household secondary attack rate, or the proportion of susceptible contacts who become ill given an initial infected individual in a household, can be used as a metric of how infectious circulating pathogens are. Household secondary attack rate of febrile illness as collected from Kinsa thermometers have been found to be significantly correlated with CDC’s ILI data prior to the COVID-19 pandemic, and significantly correlated with COVID-19 case incidence during the pandemic.
Evaluation of public health interventions is key in assessing if they are reaching the intended populations and having the desired impact. This provides an important feedback loop in modifying interventions to ensure they are addressing the public health need in question. Kinsa’s data offers a unique tool for quickly assessing the effectiveness of an intervention among the population in real-time.
Kinsa’s fever data is highly correlated with CDC’s outpatient ILINet data, but provides the benefits availability in real time compared to the 1-2 week lag from ILINet, availability with more specific geographic granularity, and potentially encompassing a more geographically diverse population than ILINet, which is comprised of reporting from about 3000 providers. Accordingly, Kinsa’s data can identify changes in illness trends and allows for assessment and response more quickly than existing disease surveillance infrastructure.
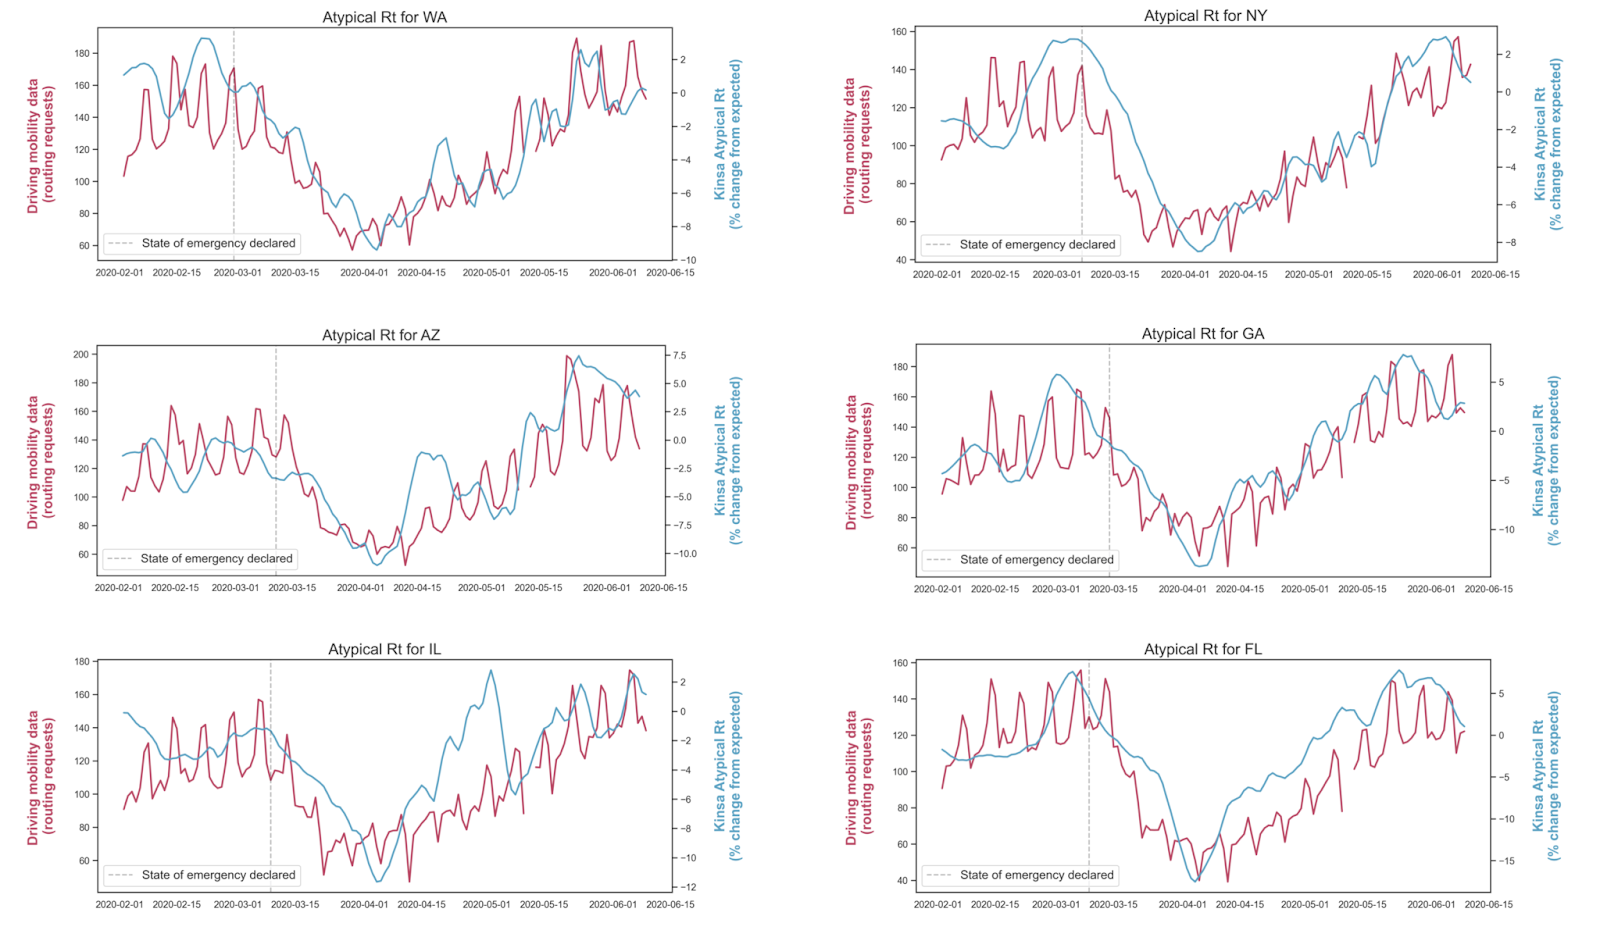
This was demonstrated early in the COVID-19 pandemic, when social distancing measures were first instituted. A Harvard study found that at a county level, reductions in mobility (a proxy for social distancing) were associated with declines in Kinsa fever incidence approximately 6.5 days following the implementation of an intervention; this time frame fits within the incubation period of COVID-19, suggesting that these initial interventions were successful at lowering disease transmission. Similar strong associations between the effective reproductive number (Rt) derived from Kinsa data and mobility data were observed at the state-level across the lower 48 states (correlation coefficient, r = 0.83). Kinsa febrile illness prevalence and Rt were observed to drop following interventions such as mask mandates, school closures, and bar/restaurant closures in several jurisdictions including New York City, Missouri, and Miami. The ability of Kinsa data to provide real-time metrics could help jurisdictions determine which COVID-19 interventions are effective and if more stringent measures are needed to control an outbreak.
Breakthrough science (COVID-19 detection/ tracking, and long-lead flu forecasting)*
Other recent publications on COVID-19 detection/ tracking*
Peer-reviewed papers prior to COVID-19 showing the utility of Kinsa data for flu forecasting
* some may be pending publication or undergoing peer-review

